Visualizing K-Means Clustering
K-Means Clustering is a Machine Learning Technique that aims to group data points into a predetermined number of clusters. Data points are more similar the closer they are to each other on the data plot. The center of each cluster is referred to as a centroid. For example, this K-Means Clustering data plot has three centroids (which are represented as bigger and darker dots).
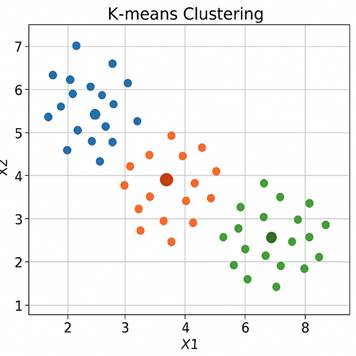
In this plot, the blue and green data points are the most distinct from one another, as they are the farthest apart.
Real-World Applications of K-Means Clustering
K-Means clustering is widely used across industries because it’s a simple and efficient method for identifying patterns in data. For commerce, companies can use K-Means clustering to group their customers into clusters based on demographic or purchase behavior (e.g., big spenders, occasional buyers, etc.) It can be used in image compression by reducing the number of colors in an image through clustering of similar pixel colors, thereby compressing the file while preserving quality.
It can also be a powerful tool for analyzing malware by grouping files based on similar behaviors or characteristics. Security analysts can use K-Means clustering to extract features from malware samples (such as API call patterns, network activity, file size, permissions, or embedded strings) and represent each sample as a numerical vector. K-Means then clusters these vectors into groups where samples exhibit similar traits. For example, ransomware variants may form one cluster due to shared behaviors, such as mass file encryption and communication with a command-and-control server. In contrast, spyware forms another based on data exfiltration patterns.
This clustering allows analysts to identify and track entire families of threats, even if individual malware samples are previously unknown. It streamlines analysis by enabling security teams to investigate representative clusters instead of every file, thereby improving the detection of emerging threats and prioritizing responses.
The Math Behind It
It begins by randomly selecting a certain number of initial centroids (the number is labeled as K), which serve as the centers of the clusters. Each data point is then assigned to the nearest centroid based on Euclidean distance (the straight-line distance between two points in space). Once all points have been assigned, the algorithm recalculates the centroid of each cluster by taking the average of all points within that cluster. This process of assigning points and updating centroids continues iteratively.
The goal of K-Means is to minimize a cost function called the within-cluster sum of squares, which is the total squared distance between each point and its assigned centroid. Mathematically, this is written as:
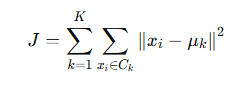
Where ![]() is the centroid of cluster k, and
is the centroid of cluster k, and ![]() is the set of points in that cluster? The algorithm stops when the assignments no longer change, or the centroids move very little, meaning it has likely reached a local minimum of this cost function. The formula and math may look daunting, but in the modern day, we have technology that can do the calculations for us. This blog will guide you through getting a K-Means clustering algorithm running in just 5 minutes using Python.
is the set of points in that cluster? The algorithm stops when the assignments no longer change, or the centroids move very little, meaning it has likely reached a local minimum of this cost function. The formula and math may look daunting, but in the modern day, we have technology that can do the calculations for us. This blog will guide you through getting a K-Means clustering algorithm running in just 5 minutes using Python.
Implementing K-Means Clustering in Python
The machine learning platform we will use is Google Colab. Google Colab (short for Google Colaboratory) is a free cloud-based platform that allows you to write and run Python code in a Jupyter notebook-style interface. It’s beginner-friendly and ideal for machine learning.
In this blog, we will use a synthetic, yet realistic, dataset that simulates activity on a hypothetical network. Each session is labeled as either “normal” or “malicious” and includes two features: login attempts and src bytes (bytes sent from source to destination).
Getting Set Up
After opening a new notebook in Colab, the first step is to import a few libraries. We need Pandas to read and manipulate the downloaded dataset, NumPy for its numerical computation functions, Scikit-Learn because it contains the actual K-Means clustering algorithm, and Matplotlib and Seaborn to plot and visualize the clusters.
import pandas as pd
import numpy as np
from sklearn.cluster import KMeans
import matplotlib.pyplot as plt
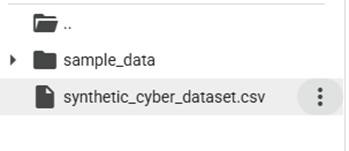
import seaborn as snsNext, we need to import the data set. To do this, import the file into Colab. Then, copy its path and paste it into this code line:
df = pd.read_csv(" **PASTE PATH HERE** ")
Setting our Variables
Next, select only the input features (login_attempts, src_bytes). Since K-Means clustering is an unsupervised machine learning method, it doesn’t use the actual labels during training.
X = df[["login_attempts", "src_bytes"]].valuesCreating the Clusters
Since we expect two groups, normal and malicious, we will create a K-Means object with 2 clusters. We will set the random_state seed to 42 for consistency when comparing our findings.
kmeans = KMeans(n_clusters=2, random_state=42)
df["cluster"] = kmeans.fit_predict(X)
Plotting our Findings
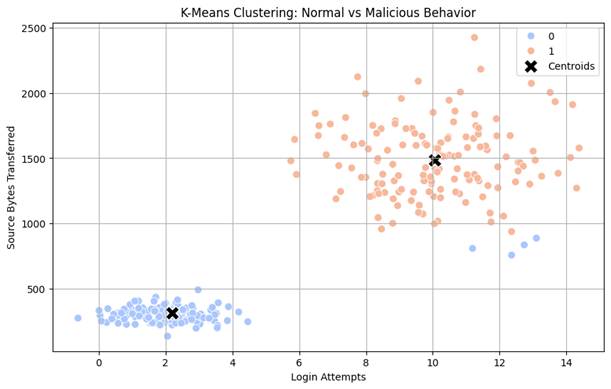
Finally, we’ll use the seaborn and matplotlib functions to visualize the clusters, plot the centroids, and label everything. 0 will indicate normal, and one will indicate malicious.
# Visualizes the clusters
plt.figure(figsize=(10, 6))
sns.scatterplot(
    x=df["login_attempts"],
    y=df["src_bytes"],
    hue=df["cluster"],
    palette="coolwarm",
    s=60
)
# Plots centroids
centroids = kmeans.cluster_centers_
plt.scatter(centroids[:, 0], centroids[:, 1],
            c='black', s=200, marker='X', edgecolors='white', label='Centroids')
# Labels and titles
plt.title("K-Means Clustering: Normal vs Malicious Behavior")
plt.xlabel("Login Attempts")
plt.ylabel("Source Bytes Transferred")
plt.legend()
plt.grid(True)
plt.show()
Error
As you can see, the algorithm did a good job of grouping the data points into the right clusters for the most part. However, there does seem to be some error.
A few data points are marked normal even though they are closer to the malicious cluster. This is because K-Means assigns each point to the centroid that is closest to it. So even if a point lies visually inside the red cluster’s density, if it’s mathematically closer to the blue cluster centroid in Euclidean space, it’ll be labeled as blue. This is a core technical limitation of the K-Means Clustering algorithm. It doesn’t consider cluster density or shape, just Euclidean centroid distance.
The two input variables have very different ranges. So, the larger range of values in src bytes will dominate the distance calculation, skewing the centroid positions and boundaries. These problems can be fixed with feature scaling. Feature scaling is the process of transforming input features so that they are on a similar scale, especially when they vary in magnitude. This is achieved in many machine learning algorithms, including K-Means, SVM, and Logistic Regression, among others.
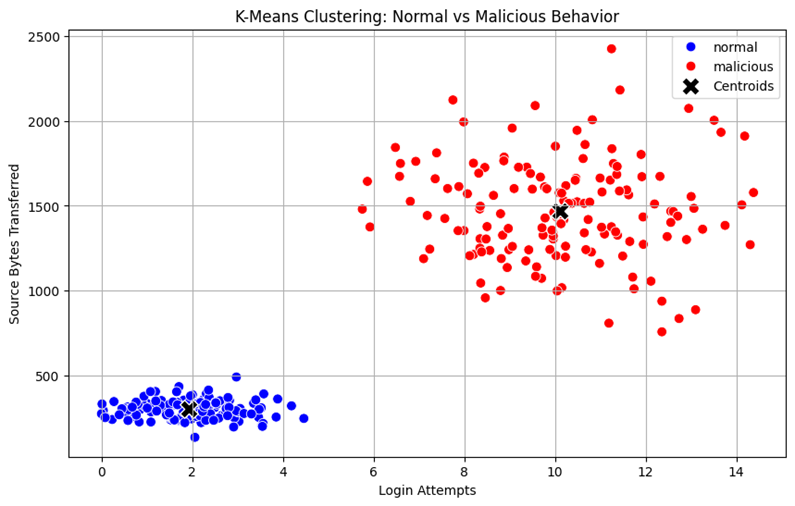
After feature scaling, the out-of-place blue data points have been removed.
Complete Code at the Auxin GitHub
You can download the complete code and notebook with and without feature scaling from our Auxin GitHub.
Key Takeaways
K-Means clustering is a simple but powerful tool for uncovering patterns in unlabeled data. In this tutorial, we applied it to a cybersecurity dataset to distinguish between regular and malicious activity using two key features: login attempts and source bytes transferred. With just a few lines of code, we were able to visualize distinct behavioral clusters, demonstrating the accessibility and practicality of K-Means for real-world analysis.
While the algorithm is efficient, it does come with limitations. It relies solely on distance to assign clusters and doesn’t account for shape or density, which can lead to misclassifications, especially when features have very different scales. As we saw, applying feature scaling greatly improves the clustering results by ensuring each variable contributes fairly. With these adjustments, K-Means becomes a much more accurate and insightful tool for identifying patterns and anomalies in data.
Auxin Security specializes in data science and machine learning consulting, helping organizations extract insights and drive innovation. We also provide specialized cloud cybersecurity services that integrate analytics into threat detection and protection. For more resources and research, visit our website.